These Burger King statistics highlight the brand’s latest footprint, franchise structure, U.S. comparable sales, franchisee profitability, and investment benchmarks from official Restaurant Brands International disclosures.
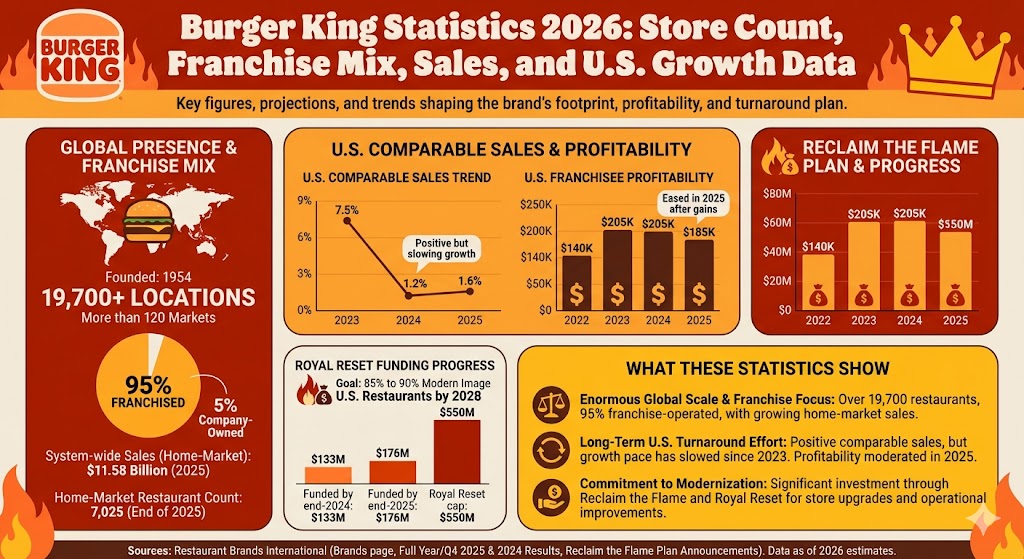
The Burger King system operates more than 19,700 locations in more than 120 markets.
Approximately 95% of Burger King restaurants are owned and operated by independent franchisees.
Burger King’s home-market system-wide sales reached $11.58 billion in 2025.
Burger King’s home-market restaurant count stood at 7,025 at the end of 2025.
Burger King U.S. comparable sales increased 1.6% in 2025 after rising 1.2% in 2024.
Burger King U.S. franchisee profitability was about $185,000 in 2025.
Burger King U.S. franchisee profitability was about $205,000 in both 2023 and 2024, up from $140,000 in 2022.
Burger King announced a $400 million Reclaim the Flame plan in 2022.
By 2024, Burger King said the broader Reclaim the Flame plan would reach up to $700 million through 2028.
Royal Reset funding reached $176 million by December 31, 2025.
Burger King aims to reach 85% to 90% modern image across U.S. restaurants by 2028.
Burger King Global Footprint
Burger King remains one of the world’s largest hamburger chains. Restaurant Brands International says the brand now operates more than 19,700 restaurants across more than 120 markets, and about 95% of the system is franchise-operated.
Burger King U.S. Comparable Sales Trend
Label
Bar
Value
2023
7.5%
2024
1.2%
2025
1.6%
Max = 7.5%. Widths: 2023 100.00%, 2024 16.00%, 2025 21.33%
Max = $550M. Widths: Funded by end-2024 24.18%, Funded by end-2025 32.00%, Royal Reset cap 100.00%
What These Burger King Statistics Show
Burger King’s latest numbers show a business that is still enormous in scale, highly franchise-driven, and focused on improving U.S. performance through store upgrades, marketing, and operational investment. The chain’s global footprint remains above 19,700 restaurants, while home-market sales continue to edge higher.
At the same time, the data also shows why Burger King’s U.S. turnaround remains a long-term effort. Comparable sales growth in 2024 and 2025 was positive, but well below the stronger 2023 pace, and franchisee profitability eased in 2025 after the gains seen in 2023 and 2024.
Sources
Restaurant Brands International, Brands page
Restaurant Brands International, Full Year and Fourth Quarter 2025 Results
Restaurant Brands International, Full Year and Fourth Quarter 2024 Results
Restaurant Brands International, Burger King Announces Reclaim the Flame Plan to Accelerate Growth in the U.S.
Restaurant Brands International, Burger King Announces Additional Investment to Achieve 85-90% Modern Image in U.S. Restaurants by 2028
Harness the power of organization with the 10 best burger tool holder belts that can elevate your grilling game—discover which ones will transform your cookouts!
Discover the top 10 outdoor cooking stations that can transform your camping experience, but which one will be the ultimate game-changer for your adventure?
Prepare for the ultimate BBQ with our top 10 grill brushes featuring scrapers that ensure a spotless cookout; discover which one perfects your grilling game!
Navigate the world of cold smoke generators to discover the top 10 that promise perfectly infused flavors; which one will elevate your smoking experience?