Wendy’s Statistics 2026: Revenue, Sales, Restaurant Count, and Growth Trends

Written by: Associate Editor
Published on:

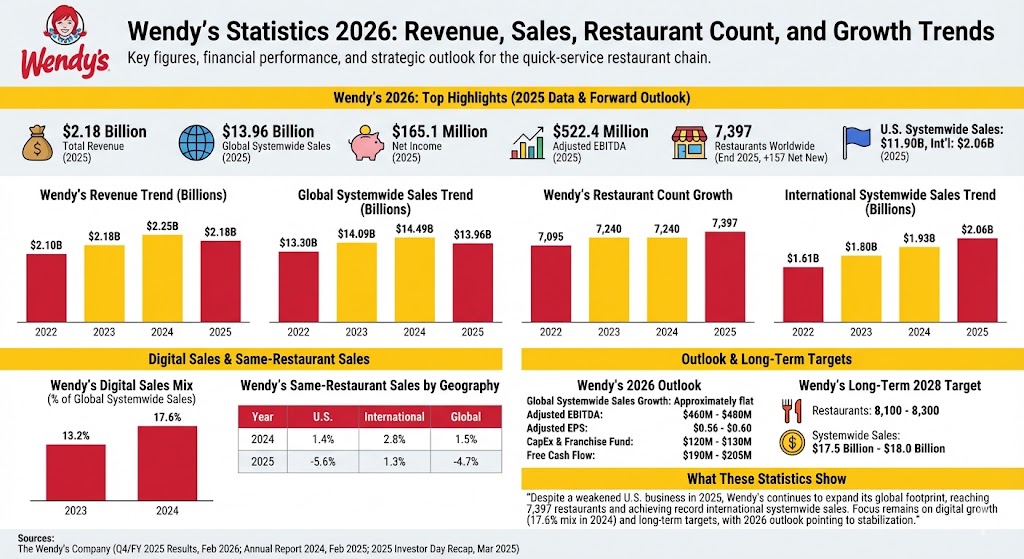
These Wendy’s statistics highlight the company’s latest revenue, systemwide sales, restaurant footprint, digital mix, and growth outlook.

The figures below use Wendy’s reported company revenue and systemwide sales metrics, which are not the same thing because systemwide sales include franchise restaurant sales while reported revenue does not.

Wendy’s statistics
Wendy’s statistics

Wendy’s statistics 2026: Top highlights

  • Wendy’s generated $2.18 billion in total revenue in 2025.
  • Global systemwide sales were $13.96 billion in 2025.
  • Wendy’s reported $165.1 million in net income for 2025.
  • Adjusted EBITDA totaled $522.4 million in 2025.
  • Wendy’s ended 2025 with 7,397 restaurants worldwide.
  • The chain added 157 net new restaurants in 2025.
  • U.S. systemwide sales were $11.90 billion in 2025.
  • International systemwide sales rose to $2.06 billion in 2025.
  • In 2025, U.S. same-restaurant sales fell 5.6%, while international same-restaurant sales increased 1.3%.
  • Digital sales reached 17.6% of global systemwide sales in 2024, up from 13.2% in 2023.
  • Wendy’s 2026 outlook calls for approximately flat global systemwide sales growth and $460 million to $480 million in adjusted EBITDA.
  • Wendy’s long-term 2028 target is 8,100 to 8,300 restaurants and $17.5 billion to $18.0 billion in systemwide sales.

Wendy’s revenue trend

LabelBarValue
2022
 
$2.10B
2023
 
$2.18B
2024
 
$2.25B
2025
 
$2.18B

Max = $2.25B. Widths: 2022 93.28%, 2023 97.11%, 2024 100.00%, 2025 96.90%

Wendy’s global systemwide sales trend

LabelBarValue
2022
 
$13.30B
2023
 
$14.09B
2024
 
$14.49B
2025
 
$13.96B

Max = $14.49B. Widths: 2022 91.81%, 2023 97.24%, 2024 100.00%, 2025 96.37%

Wendy’s restaurant count growth

LabelBarValue
2022
 
7,095
2023
 
7,240
2024
 
7,240
2025
 
7,397

Max = 7,397. Widths: 2022 95.92%, 2023 97.88%, 2024 97.88%, 2025 100.00%

Wendy’s international systemwide sales trend

LabelBarValue
2022
 
$1.61B
2023
 
$1.80B
2024
 
$1.93B
2025
 
$2.06B

Max = $2.06B. Widths: 2022 77.82%, 2023 87.32%, 2024 93.68%, 2025 100.00%

Wendy’s digital sales mix

LabelBarValue
2023
 
13.2%
2024
 
17.6%

Max = 17.6%. Widths: 2023 75.00%, 2024 100.00%

Wendy’s same-restaurant sales by geography

YearU.S.InternationalGlobal
20241.4%2.8%1.5%
2025-5.6%1.3%-4.7%

Wendy’s 2026 outlook

Metric2026 outlook
Global systemwide sales growthApproximately flat
Adjusted EBITDA$460M to $480M
Adjusted earnings per share$0.56 to $0.60
Capital expenditures and franchise development fund investments$120M to $130M
Free cash flow$190M to $205M

What these Wendy’s statistics show

The latest Wendy’s statistics show a brand that is still expanding its footprint even though its U.S. business weakened in 2025. Global restaurant count reached 7,397 by year-end 2025, and international systemwide sales continued climbing to a new high, which helped soften the impact of lower U.S. same-restaurant sales.

They also show where Wendy’s is putting its focus. Digital sales made up 17.6% of global systemwide sales in 2024, management is targeting 8,100 to 8,300 restaurants by 2028, and 2026 guidance points to a stabilization year while the company works to improve traffic, margins, and long-term growth.

Sources

  • The Wendy’s Company, Fourth Quarter and Full Year 2025 Results and 2026 Outlook, February 2026
  • The Wendy’s Company Annual Report 2024, filed February 2025
  • Wendy’s 2025 Investor Day Recap, March 2025