These fast food market statistics cover the latest market size estimates, sales benchmarks, ordering behavior, and chain-level revenue data shaping the fast food and quick service restaurant industry in 2026.
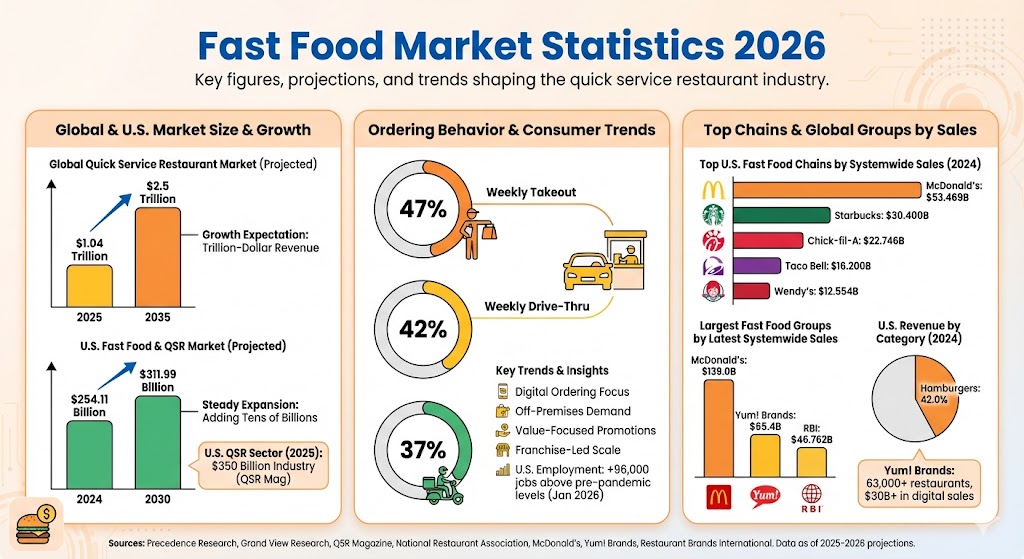
The global quick service restaurant market is expected to rise from $1.04 trillion in 2025 to $2.5 trillion by 2035.
Grand View Research valued the U.S. fast food and quick services restaurants market at $254.11 billion in 2024 and projected it to reach $311.99 billion by 2030.
QSR Magazine described the U.S. quick-service sector as a $350 billion industry in 2025.
The National Restaurant Association projected total U.S. restaurant industry sales of $1.5 trillion and 15.9 million jobs in 2025.
47% of adults say they pick up takeout at least once a week, 42% use the drive-thru weekly, and 37% order delivery weekly.
Quickservice and fast casual restaurant employment was 96,000 jobs above pre-pandemic levels as of January 2026.
Hamburgers accounted for 42.0% of U.S. fast food and quick service restaurant revenue in 2024 in Grand View Research’s market breakdown.
McDonald’s reported more than $139 billion in global systemwide sales in 2025.
Yum! Brands says its portfolio includes 63,000+ restaurants in 155+ countries and territories, with $65.4 billion in total system sales and more than $30 billion in digital sales.
Restaurant Brands International reported $46.762 billion in systemwide sales and 33,041 restaurants in 2025.
QSR Magazine’s 2025 ranking put McDonald’s at $53.469 billion in U.S. systemwide sales in 2024, ahead of Starbucks at $30.4 billion and Chick-fil-A at $22.746 billion.
Global fast food market size statistics
Market forecasts for quick service restaurants remain aggressive, with trillion-dollar global revenue expectations over the next decade. That reflects continued demand for convenience, chain expansion, delivery integration, and digital ordering.
Label
Bar
Value
2025
$1.04T
2035
$2.50T
Max = $2.50T. Widths: 2025 41.60%, 2035 100.00%
U.S. fast food market size statistics
In the United States, sector forecasts point to steady expansion rather than explosive growth. Current projections suggest the market can add tens of billions of dollars in revenue by the end of the decade, even in a slower-growth environment.
Label
Bar
Value
2024
$254.11B
2030
$311.99B
Max = $311.99B. Widths: 2024 81.45%, 2030 100.00%
Fast food ordering behavior statistics
Convenience remains one of the clearest demand drivers. Weekly takeout, drive-thru, and delivery usage all remain high, which helps explain why fast food and limited-service chains continue to invest in app ordering, pickup, and off-premises formats.
Chain-level sales remain highly concentrated. McDonald’s still sits comfortably at the top, while Starbucks, Chick-fil-A, Taco Bell, and Wendy’s round out the leading group in QSR Magazine’s latest U.S. ranking.
Label
Bar
Value
McDonald’s
$53.469B
Starbucks
$30.400B
Chick-fil-A
$22.746B
Taco Bell
$16.200B
Wendy’s
$12.554B
Max = $53.469B. Widths: McDonald’s 100.00%, Starbucks 56.86%, Chick-fil-A 42.54%, Taco Bell 30.30%, Wendy’s 23.48%
Largest fast food groups by latest systemwide sales
At the corporate-group level, scale is concentrated in a handful of giants. McDonald’s leads on disclosed systemwide sales, while Yum! Brands and Restaurant Brands International still operate at enormous global scale across thousands of franchised locations.
The fast food market is still growing, but the clearest story is not just store count expansion. It is the combination of digital ordering, off-premises demand, value-focused promotions, and huge franchise-led operating scale.
Another important point is that market-size estimates vary by firm and by definition. Some trackers focus on U.S. fast food and quick service restaurants, while others model the broader global quick service market. Even so, the direction is consistent: the sector remains one of the biggest and most resilient segments in foodservice.
Sources
Precedence Research, Quick Service Restaurant Market, January 2026
Grand View Research, U.S. Fast Food and Quick Services Restaurants Market, January 2025
QSR Magazine, The 2025 QSR 50 and related rankings, August 2025
National Restaurant Association, State of the Restaurant Industry and Off-Premises Restaurant Trends, 2025 to 2026
McDonald’s fourth-quarter and full-year 2025 results, February 2026
McDonald’s 2024 annual report and restaurant count disclosure, April 2025
Yum! Brands investor and company pages, accessed March 2026
Restaurant Brands International fourth-quarter and full-year 2025 results, February 2026
Bite into burger perfection with our top 10 stuffed burger maker presses that promise juicy, flavorful patties every time; discover which ones made the cut!
Shine a light on your nighttime BBQ adventures with the top 10 magnetic grill lights that will transform your cooking experience—discover the perfect one for you!
Hit the perfect outdoor cooking experience with the top 10 propane grills featuring side burners in 2025—discover which ones will elevate your grilling game!
Discover the top 10 outdoor cooking stations that can transform your camping experience, but which one will be the ultimate game-changer for your adventure?
Master the art of smoking with the top 10 propane smoker cabinets of 2025 that promise mouthwatering results—discover which one will elevate your BBQ game!