Shake Shack Statistics 2026: Revenue, Store Count, Sales, and Growth

Written by: Associate Editor
Published on:

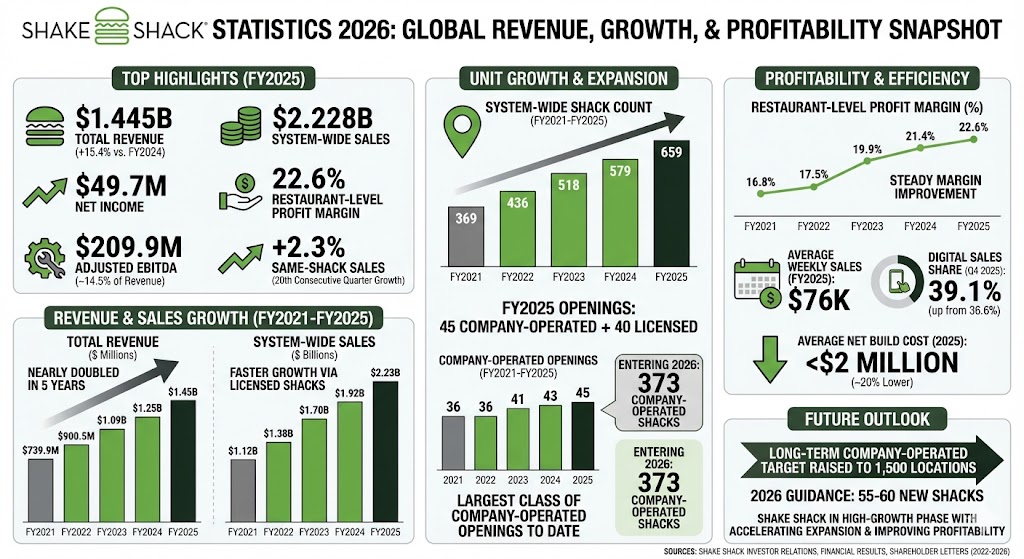
These Shake Shack statistics show how the burger chain has expanded its revenue, system-wide sales, unit count, and profitability in recent years. The latest figures combine fiscal 2025 results with early 2026 company updates to show where the business stands now.

Shake Shack statistics

Shake Shack statistics 2026 (Top highlights)

  • Shake Shack generated $1.4453 billion in total revenue in fiscal 2025, up 15.4% from fiscal 2024.
  • System-wide sales reached $2.2288 billion in fiscal 2025.
  • Net income totaled $49.7 million in fiscal 2025.
  • Restaurant-level profit rose to $314.5 million in fiscal 2025, equal to a 22.6% restaurant-level profit margin.
  • Adjusted EBITDA reached about $209.9 million in fiscal 2025, or roughly 14.5% of total revenue.
  • Same-Shack sales increased 2.3% in fiscal 2025.
  • Q4 2025 marked Shake Shack’s 20th consecutive quarter of positive same-Shack sales growth.
  • Shake Shack opened 45 new company-operated Shacks and 40 new licensed Shacks in fiscal 2025.
  • System-wide Shack count grew from 579 in fiscal 2024 to 659 in fiscal 2025.
  • Shake Shack entered 2026 with 373 company-operated restaurants.
  • The company guided to open 55 to 60 additional Shacks in 2026.
  • Average weekly sales held at $76K in fiscal 2025.
  • Digital sales accounted for 39.1% of Shack sales in Q4 2025, up from 36.6% a year earlier.
  • Average net build cost for new Shacks fell to under $2 million in 2025, about 20% lower than the prior year.
  • Management raised its long-term company-operated Shack opportunity from 450 to 1,500 locations in January 2025.

Shake Shack total revenue by year

LabelBarValue
FY2021
 
$739.9M
FY2022
 
$900.5M
FY2023
 
$1.09B
FY2024
 
$1.25B
FY2025
 
$1.45B

Max = $1,445.3M. Widths: FY2021 51.19%, FY2022 62.31%, FY2023 75.24%, FY2024 86.67%, FY2025 100.00%

Shake Shack’s annual revenue nearly doubled between fiscal 2021 and fiscal 2025, reflecting both higher sales volume and a larger restaurant base.

Shake Shack system-wide sales by year

LabelBarValue
FY2021
 
$1.12B
FY2022
 
$1.38B
FY2023
 
$1.70B
FY2024
 
$1.92B
FY2025
 
$2.23B

Max = $2,228.8M. Widths: FY2021 50.39%, FY2022 61.85%, FY2023 76.37%, FY2024 86.27%, FY2025 100.00%

System-wide sales have risen faster than total revenue because Shake Shack also earns fees from licensed restaurants whose full sales are not booked as company revenue.

Shake Shack system-wide Shack count by year

LabelBarValue
FY2021
 
369
FY2022
 
436
FY2023
 
518
FY2024
 
579
FY2025
 
659

Max = 659. Widths: FY2021 55.99%, FY2022 66.16%, FY2023 78.60%, FY2024 87.86%, FY2025 100.00%

Shake Shack added 290 system-wide Shacks over four years, showing how heavily the business has leaned into new-unit growth.

Shake Shack restaurant-level profit margin by year

LabelBarValue
FY2021
 
16.8%
FY2022
 
17.5%
FY2023
 
19.9%
FY2024
 
21.4%
FY2025
 
22.6%

Max = 22.6%. Widths: FY2021 74.34%, FY2022 77.43%, FY2023 88.05%, FY2024 94.69%, FY2025 100.00%

Margins improved steadily from fiscal 2021 through fiscal 2025, which helps explain why Shake Shack’s EBITDA and earnings rose faster than revenue over the same stretch.

Shake Shack company-operated openings by year

LabelBarValue
2021
 
36
2022
 
36
2023
 
41
2024
 
43
2025
 
45

Max = 45. Widths: 2021 80.00%, 2022 80.00%, 2023 91.11%, 2024 95.56%, 2025 100.00%

Shake Shack’s company-operated opening pace kept rising, and 2025 became its largest class of company-operated openings to date.

What these Shake Shack statistics show

Shake Shack is still in a high-growth phase. Revenue, system-wide sales, and total Shack count have all moved sharply higher since fiscal 2021, while profitability metrics have also improved rather than slipping under the weight of expansion.

The latest updates also show that management is still planning to scale aggressively. With 373 company-operated restaurants entering 2026, a target of 55 to 60 new Shacks this year, lower build costs, and a much larger long-term unit opportunity, Shake Shack is positioning itself for another expansion cycle.

Sources

  • Shake Shack Investor Relations, Shake Shack Announces Fourth Quarter and Fiscal Year 2025 Financial Results, February 26, 2026.
  • Shake Shack Investor Relations, Q4 2025 Shareholder Letter, February 26, 2026.
  • Shake Shack Investor Relations, Shake Shack Provides Fiscal Fourth Quarter 2025 Business Update, January 12, 2026.
  • Shake Shack Investor Relations, Shake Shack Announces Fourth Quarter and Fiscal Year 2024 Financial Results, February 20, 2025.
  • Shake Shack Investor Relations, Shake Shack Announces Fourth Quarter and Fiscal Year 2023 Financial Results, February 15, 2024.
  • Shake Shack Investor Relations, Shake Shack Announces Fourth Quarter and Fiscal Year 2022 Financial Results, February 16, 2023.
  • Shake Shack Investor Relations, Shake Shack Announces Fourth Quarter and Fiscal Year 2021 Financial Results, February 17, 2022.