These Sonic Drive-In statistics highlight the latest available figures on systemwide sales, average unit volumes, restaurant footprint, rewards mechanics, and community impact.
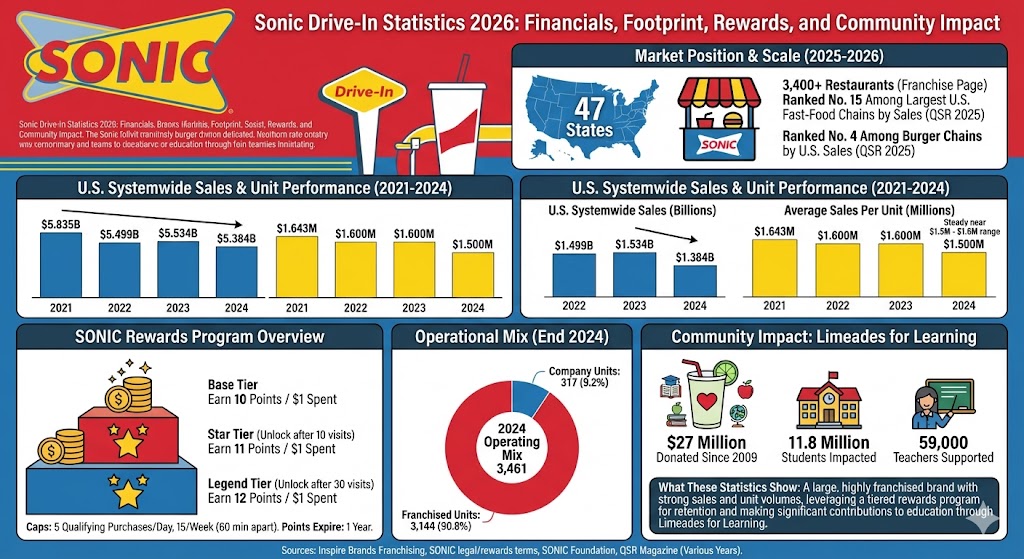
SONIC’s current franchise page says the brand has more than 3,400 restaurants across 47 states.
In QSR’s 2025 ranking, Sonic Drive-In ranked No. 15 among the largest U.S. fast-food chains by sales.
In the 2025 burger segment ranking, Sonic Drive-In ranked No. 4 among burger chains by U.S. sales.
Sonic posted about $5.384 billion in U.S. systemwide sales for 2024.
Sonic’s average sales per unit were about $1.5 million in 2024.
Sonic ended 2024 with 3,461 total U.S. units.
Of those 2024 units, 3,144 were franchised and 317 were company-operated.
Sonic generated $5.835 billion in U.S. systemwide sales in 2021, which was the highest figure in this four-year comparison.
SONIC Rewards members earn 10 points per $1 spent at the base tier, 11 points at Star Tier, and 12 points at Legend Tier.
Star Tier unlocks after 10 visits, while Legend Tier unlocks after 30 visits.
SONIC caps qualifying rewards purchases at 5 per day and 15 in any 7-day period, with orders needing to be at least 60 minutes apart to qualify.
SONIC says rewards points expire one year after they are received.
Through Limeades for Learning, SONIC reports $27 million donated since 2009.
The SONIC Foundation says Limeades for Learning has impacted 11.8 million students and supported 59,000 teachers.
Sonic Drive-In U.S. Systemwide Sales
QSR data shows Sonic’s U.S. systemwide sales remained above $5.3 billion across the last four reported years, with 2021 standing as the high point in this set.
Sonic’s average unit volumes stayed near the $1.5 million to $1.6 million range across the same period, showing relatively steady restaurant-level productivity.
Sonic remains heavily franchised, with franchise-operated restaurants accounting for the vast majority of its unit base.
Label
Bar
Value
Franchised units
3,144
Company units
317
Max = 3,144. Widths: Franchised units 100.00%, Company units 10.08%
SONIC Rewards Points Per Dollar
SONIC’s updated rewards structure increases the earning rate as members move up the loyalty ladder.
Label
Bar
Value
Base tier
10 points
Star Tier
11 points
Legend Tier
12 points
Max = 12 points. Widths: Base tier 83.33%, Star Tier 91.67%, Legend Tier 100.00%
SONIC Rewards Visit Thresholds
The program uses simple visit milestones to unlock higher earning rates and extra benefits.
Label
Bar
Value
Star Tier unlock
10 visits
Legend Tier unlock
30 visits
Max = 30 visits. Widths: Star Tier unlock 33.33%, Legend Tier unlock 100.00%
Sonic Foundation and Community Impact
Beyond restaurant sales, Sonic’s public numbers also show a sizable education-focused community program. The SONIC Foundation says Limeades for Learning has donated $27 million since 2009, impacted 11.8 million students, and supported 59,000 teachers.
That gives Sonic a second measurable story beyond restaurant operations: the chain is not just large in store count and burger sales, but also highly visible in educator and classroom support through a long-running national initiative.
What These Sonic Drive-In Statistics Show
The latest Sonic numbers suggest a brand that remains very large, highly franchised, and still solidly positioned among America’s top burger chains. Sales have softened somewhat from the 2021 peak, but the business still operates at more than $5 billion in annual U.S. systemwide sales and maintains average unit volumes around the $1.5 million mark.
The rewards data also shows Sonic leaning hard into retention and app-based ordering. Tiered points, visit thresholds, purchase caps, and educator-specific rewards all point to a strategy centered on repeat traffic, digital engagement, and targeted promotions rather than broad-based footprint expansion alone.
Sources
Inspire Brands Franchising, SONIC franchise page, accessed 2026.
SONIC legal and rewards terms, updated February 24, 2026.
SONIC Foundation, Limeades for Learning page, accessed 2026.
QSR Magazine, The Top 50 Fast-Food Chains of 2021.
QSR Magazine, Ranked: The Top 50 Fast-Food Chains in America, 2023.
QSR Magazine, QSR 50 2024: Top Fast-Food Chains, Ranked by Sales.
QSR Magazine, QSR 50 2025: Top 50 Fast-Food Chains, Ranked by Sales.
QSR Magazine, QSR 50 2025: Top Fast-Food Burger Chains, Ranked by Sales.
Navigate the world of grilling with the 10 best burger and meat thermometers that promise to elevate your cooking skills—discover which one suits you best!
Just when you thought your grilling setup was complete, discover the top 10 burger prep tables for 2025 that can elevate your outdoor cooking experience!