These US drive-thru statistics show that the channel still plays a central role in quick-service restaurant demand, even as ordering gets more digital and more complex.
Recent industry data points to strong off-premises traffic, a clear consumer preference for drive-thru ordering, modest gains in speed and satisfaction, and a new wave of AI testing that is improving some parts of the experience while creating tradeoffs in friendliness and accuracy.
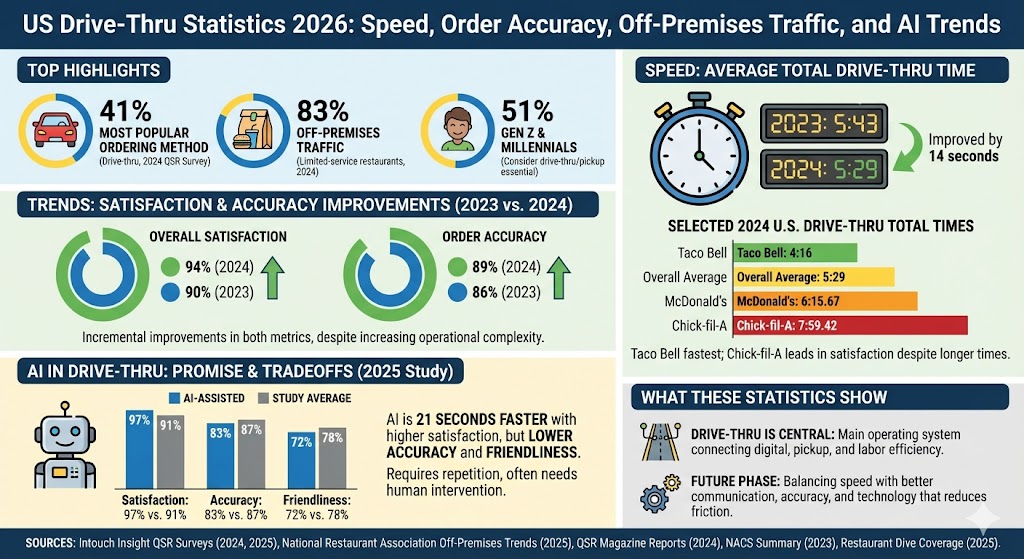
Drive-thru was the most popular ordering method in Intouch Insight’s 2024 QSR consumer survey at 41%, ahead of in-store cashier ordering at 26% and restaurant app ordering at 15%.
The National Restaurant Association said off-premises traffic at limited-service restaurants rose from 76% of traffic in 2019 to 83% in 2024.
Among Gen Z and millennial consumers, 51% said picking up takeout or ordering drive-thru meals is essential to their lifestyle.
In the 2024 Intouch Insight and QSR drive-thru study, overall satisfaction improved from 90% in 2023 to 94% in 2024.
Average total drive-thru time improved from 5 minutes 43 seconds in 2023 to 5 minutes 29 seconds in 2024.
Order accuracy improved from 86% in 2023 to 89% in 2024.
Taco Bell posted the fastest 2024 average total time at 4 minutes 16 seconds, while Chick-fil-A averaged 7 minutes 59.42 seconds in the 2024 report.
In Intouch Insight’s 2025 study, AI-assisted drive-thru orders were 21 seconds faster and reached 97% satisfaction, but order accuracy slipped to 83% versus the 87% study average.
Preferred Ordering Methods in Fast-Food Restaurants
Drive-thru remains the leading ordering channel in Intouch Insight’s 2024 QSR consumer survey. That matters because it means the lane is still the largest single operational touchpoint for many quick-service brands, even before adding pickup, kiosk, and app-driven demand into the broader off-premises mix.
The National Restaurant Association’s 2025 off-premises research shows that limited-service restaurants are now even more dependent on traffic that happens outside the dining room. That shift helps explain why drive-thru speed, lane design, speaker clarity, app integration, and order accuracy continue to attract so much investment.
Drive-Thru Satisfaction in the 2024 Study
Label
Bar
Value
2023
90%
2024
94%
Max = 94%. Widths: 2023 95.74%, 2024 100.00%
Drive-Thru Order Accuracy in the 2024 Study
Label
Bar
Value
2023
86%
2024
89%
Max = 89%. Widths: 2023 96.63%, 2024 100.00%
The 2024 results were better on both satisfaction and accuracy. Even so, the improvement was incremental rather than dramatic, which fits the industry’s current reality: brands are making the lane more digital, but each transaction is also becoming more customized and operationally complicated.
Average Total Drive-Thru Time
Label
Bar
Value
2023
5:43
2024
5:29
Max = 343.00 seconds. Widths: 2023 100.00%, 2024 95.93%
Selected 2024 U.S. Drive-Thru Total Times
Label
Bar
Value
Taco Bell
4:16
Overall average
5:29
McDonald’s
6:15.67
Chick-fil-A
7:59.42
Max = 479.42 seconds. Widths: Taco Bell 53.40%, Overall average 68.64%, McDonald’s 78.36%, Chick-fil-A 100.00%
The spread in total times shows how different drive-thru strategies can look across major chains. Taco Bell led on speed, while Chick-fil-A still led on satisfaction. In other words, the fastest brand is not always the brand with the strongest overall guest experience.
AI-Assisted vs Study-Average Drive-Thru Metrics
Label
Bar
Value
AI satisfaction
97%
Study average satisfaction
91%
AI accuracy
83%
Study average accuracy
87%
AI friendliness
72%
Study average friendliness
78%
Max = 97%. Widths: AI satisfaction 100.00%, Study average satisfaction 93.81%, AI accuracy 85.57%, Study average accuracy 89.69%, AI friendliness 74.23%, Study average friendliness 80.41%
Early AI results are promising on speed and satisfaction, but they also show why most operators are still testing rather than fully handing the lane to automation. In the 2025 study, AI-assisted orders were 21 seconds faster, yet customers had to repeat themselves more often, friendliness was lower, and 62% of incorrect AI orders were tied to a recurring issue that often required employee intervention. When staff stepped in, accuracy improved by 14 percentage points.
What These US Drive-Thru Statistics Show
The US drive-thru is no longer just a convenience feature. It has become one of the main operating systems for limited-service restaurants, connecting mobile ordering, loyalty, digital menu boards, pickup behavior, and labor efficiency in a single lane.
The data also shows the next phase clearly. Brands still need speed, but they also need clearer communication, better accuracy, and technology that reduces friction instead of adding it. That is why the best-performing drive-thrus now combine faster processes with better speaker systems, better staffing support, and more disciplined execution around increasingly complex orders.
Sources
Intouch Insight, QSR Consumer Perceptions Survey summary, July 2024
National Restaurant Association, Off-Premises Restaurant Trends 2025, April 2025
National Restaurant Association resource article on off-premises demand, April 2025
Intouch Insight press release on the 2024 Annual Drive-Thru Study, October 2024
NACS summary of the 2023 QSR Drive-Thru Report, March 2024
QSR Magazine, 2024 Drive-Thru Report snippets and related coverage, October 2024
Restaurant Dive, coverage of the 2025 Intouch Insight drive-thru report, October 2025
Intouch Insight, 2025 Drive-Thru Study summary, October 2025
Get ready to transform your BBQ experience with the 10 best grill shelf side trays that promise practicality and convenience—discover which ones made the list!